Insights & Research
Expert perspectives on sustainability management, ESG, circular economy, and the future of green business.
10 Reasons to Study in Europe in 2026
Ten evidence-based reasons to study in Europe in 2026: world-class academic quality across aligned degree systems (the Bologna Process spans 49 countries), comparatively affordable tuition (OECD Education at a Glance 2025), thousands of English-taught degrees (British Council & Studyportals 2024), unmatched mobility across 29 Schengen countries, Erasmus+ funding of roughly EUR 26.2 billion for 2021-2027, exceptional cultural and linguistic diversity, strong international employability, European leadership on sustainability and the green economy, high quality of life and safety, and centuries of history and culture as a living classroom. The guide compares the ten reasons with verified 2024-2026 data and shows how SUMAS — with English-taught campuses in Switzerland (Gland) and Italy (Milan) — turns them into a focused sustainability education.
Millennials and Sustainability: Values, Spending and Careers in 2026
Millennials and Gen Z are driving sustainability into the core of business. This guide covers their consumption values, employer expectations, ESG demand, the value-action gap, and social-media activism, with verified 2024-2026 data from Deloitte, McKinsey/NielsenIQ and Pew Research.
4 Sustainable Marketing Lessons for Brands in 2026
Sustainable marketing in 2026 rewards brands that prove their environmental claims and penalises those that greenwash. Learn the four lessons — substantiate, be transparent, commit long-term and tell a true story — backed by verified NielsenIQ/McKinsey, Kantar and EU regulatory data.
Sustainability 101: Why Is Social Inclusion Important?
Social inclusion is the process of ensuring everyone can participate fully in economic, social, and political life — the human core of the social pillar of sustainability and the 'S' in ESG. This guide defines social inclusion, maps it to the UN SDGs (5, 8, 10), explains why it matters using verified 2024-2025 data from the World Bank, ILO, and UN Women, and shows how it is now reported under the EU ESRS S1-S4 social standards.
5 Examples of Sustainable Development (With 2026 Data)
Five concrete examples of sustainable development — renewable energy, sustainable agriculture, green buildings, the circular economy, and sustainable transport — explained with verified 2024-2026 data from IRENA, the FAO, UNEP, and the IEA. This guide defines sustainable development using the Brundtland Report and the UN Sustainable Development Goals, then shows how each example balances economic, social, and environmental goals at scale.
5 Examples of Sustainable Tourism Around the World (2026)
Five concrete examples of sustainable tourism around the world — Bhutan's high-value low-impact policy, Costa Rica's ecotourism economy, Slovenia's Green Scheme, the solar-powered Six Senses Fiji resort, and community-based tourism at Mdumbi in South Africa — explained with verified 2024-2026 data from UN Tourism, the WTTC, the GSTC, and Nature Communications. This guide defines sustainable tourism, compares the five models across the GSTC pillars, and shows why responsible travel matters as arrivals hit 1.4 billion.
20 Sustainability Facts You Should Know in 2026 (Verified Data)
Twenty verified sustainability facts for 2026, each sourced to a named authority and dated 2023-2026: 2024 as the hottest year on record (WMO), record CO2 at 423.9 ppm, 4,448 GW of renewable capacity (IRENA), clean-energy investment at twice fossil fuels (IEA), USD 16.7 trillion in sustainable funds (GSIA), one million species at risk (IPBES), plus the latest on the EU CSRD Omnibus, the SBTi Net-Zero Standard v2.0, water, waste, plastics, deforestation, and green jobs.
What Is Sustainability Management? Definition, Pillars & Why It Matters
Sustainability management is the business discipline of integrating environmental, social, and governance (ESG) factors into an organization's strategy and operations, so the company creates value today without eroding the resources future generations depend on. This guide defines sustainability management, explains its three pillars — environmental, social, and governance — and sets out why it became a boardroom imperative in 2026: tightening regulation such as the EU CSRD and ISSB IFRS S1/S2, investors pricing ESG into capital, and climate change generating measurable financial risk. It maps the discipline's key practice areas, from greenhouse gas accounting and supply chain due diligence to sustainable finance, ESG reporting, and net zero strategy, and outlines how to build a career in the field.
What Is a Green Economy? Key Concepts, Principles & Real-World Examples
A green economy is an economic model that improves human well-being and social equity while reducing environmental risks, defined by UNEP as low-carbon, resource-efficient, and socially inclusive. This guide explains its key pillars, principles, and real-world examples — from Denmark's wind power to Costa Rica's ecosystem payments and the EU Green Deal — with verified data from UNEP, the ILO, the IEA, and the UNFCCC.
What Is ESG? Environmental, Social & Governance Explained
ESG (Environmental, Social, Governance) is a framework investors and regulators use to assess how sustainability risks affect a company's value. This guide explains the three pillars, the reporting standards (IFRS S1/S2, CSRD, GRI), the 2025-2026 EU regulatory changes, and the honest debate over greenwashing and financial returns.
Are Multinational Corporations Becoming More Sustainable?
Are multinational corporations really becoming more sustainable? This 2026 analysis weighs genuine progress against greenwashing: ~63% of the Forbes Global 2000 hold net-zero targets and over 10,000 firms have SBTi-validated goals, yet only ~7% meet minimum integrity criteria and Scope 3 supply-chain emissions average 26x operations. Covers CSRD, IFRS S1/S2, the SBTi Net-Zero Standard v2.0, divestment and sustainable finance.
Circular Economy Explained: How It Works and Why It Matters
The circular economy is an economic model that eliminates waste, keeps materials in use at their highest value, and regenerates nature — replacing the linear take-make-waste system. This guide explains its principles, the two material cycles, the R-strategies, circular business models, verified economic and climate data, real limitations, and EU policy.
Sustainability Management Frameworks: Standards, Tools and Industry Applications in 2026
A practical 2026 guide to sustainability management frameworks: how IFRS S1/S2 (ISSB), the ESRS under the CSRD, GRI, the SBTi, the GHG Protocol, ISO 14001, B Corp and CDP fit together — with comparison tables and how the discipline differs across fashion, finance, food, technology and tourism.
Careers in Sustainability Management: Skills, Pathways and the Future of the Field
Sustainability management is one of the fastest-growing career fields, with demand for green talent outpacing supply. Learn the skills sustainability managers need, the academic and certification pathways into the field, typical roles and salary progression from ESG analyst to Chief Sustainability Officer, and how the discipline is evolving toward nature, technology and credible claims.
Careers in Sustainability: A 2026 Guide to Sectors, Roles, Salaries and How to Start
A broad 2026 guide to careers in sustainability: which sectors are hiring, the main types of roles from ESG analyst to Chief Sustainability Officer, realistic salary progression, and the two practical routes to start, whether you are a school-leaver, graduate or professional changing fields.
Master in Sustainable Fashion: Circular Design, LCA & Supply-Chain Ethics
A Master in Sustainable Fashion builds three core competencies — circular design, Life Cycle Assessment (LCA), and supply-chain ethics — to address an industry responsible for around 10% of global carbon emissions and 20% of global wastewater. Learn how the EU Strategy for Sustainable and Circular Textiles, EPR schemes, and the CSDDD turn these skills into a regulatory necessity, and how SUMAS programs prepare graduates for sustainable fashion careers.
Top Sustainable Business Courses in 2026: What to Study and Why It Matters
A practical guide to the sustainable business courses worth studying in 2026: sustainability strategy and governance, ESG reporting (CSRD, ISSB, GRI), sustainable finance, climate and decarbonization, and circular economy. Backed by verified data from LinkedIn, the World Economic Forum, GSIA, SBTi and the IEA, it explains what each subject teaches, why demand is rising, which course format fits your career stage, and the roles these skills lead to.
Masters in Sustainable Business Management: The Skills Employers Hire For Now
Which skills do employers hire a Masters in Sustainable Business Management for in 2026? Double materiality analysis, climate-risk assessment, ESG reporting under ISSB and CSRD, sustainable finance literacy, and value-chain redesign top the list. With green-talent demand growing about twice as fast as supply and job seekers with green skills 54.6% more likely to be hired (LinkedIn, 2024), this guide maps the competencies recruiters look for and how to demonstrate them.
MBA in Sustainable Development: From Boardroom to Biodiversity
An MBA in sustainable development integrates ESG, sustainable finance, climate strategy, and biodiversity into core management. Learn what the degree covers, why nature-related risk is the next frontier under TNFD, how the SDGs create enterprise value, and the careers it opens.
How to Evaluate an MBA in Sustainability Management: A 10-Point Checklist
A 10-point checklist for evaluating an MBA in Sustainability Management: curriculum integration, applied projects, framework training (ISSB, GRI, TNFD), data fluency, systems thinking, flexible formats, mapped careers, institutional credibility, nature-related risk and verifiable alumni outcomes. Includes verified 2024-2025 data on green hiring, GRI and ISSB adoption.
Masters in Business Sustainability: Building Finance, Strategy & ESG Fluency
A master's in business sustainability builds finance, strategy and ESG fluency together. Learn the three pillars, the reporting frameworks (ISSB, CSRD, GRI, GHG Protocol), the roles they map to, and how to choose a program, with verified 2023-2025 data from GSIA, LinkedIn, the WEF and SBTi.
Green MBA Explained: What Employers Mean and How to Choose One
A Green MBA is an MBA that embeds sustainability, ESG and climate-risk literacy into every core management course. Learn what employers mean by the term, which competencies it signals, why demand is rising, and five criteria for choosing a credible programme.
MSc Environmental Management vs a Management Route: Where Each Degree Excels in 2026
MSc in Environmental Management or a management-focused sustainability master? The MSc builds scientific and technical depth for conservation, regulation, and environmental analysis, while a Master or MBA in Sustainability Management builds the ESG strategy, reporting, finance, and leadership skills organisations hire for. Compare focus, skills, and careers, and learn how to choose the right route for your goals in 2026.
SUMAS Career Fair 2025: Connecting Students With Sustainability Practitioners
The SUMAS Career Fair 2025 (4-5 December) connected students with practitioners in ESG strategy, sustainability consulting, DEI, circular social enterprise, and responsible travel, helping them map purpose-driven career pathways in a labour market where green skills are in high demand.
Top Features of Sustainability Management Master's Programs in 2026
What separates a substantive sustainability management master's from a rebranded business degree in 2026? This guide sets out the verifiable features to check before you enrol: recognised accreditation, a curriculum where sustainability is integrated into strategy and finance, real industry projects, fluency in reporting frameworks such as ISSB IFRS S1/S2 and the EU CSRD, links to UN-backed initiatives like PRME, and measurable career outcomes. Includes dated market data and how SUMAS programs map to each feature.
Green Milan: Where Experiential Learning Meets the Future of Sustainability
Green Milan is the SUMAS experiential camp that turns Milan into a living classroom for sustainability management, with five themed days on tourism, gastronomy, fashion, urban nature, and design. Learn how experiential learning builds real sustainability leadership and how Milan's circular-economy progress makes it a credible field laboratory.
Regular MBA vs. Sustainability MBA: What's the Difference?
A regular MBA and a Sustainability MBA share the same business core, but the Sustainability MBA adds ESG reporting, sustainable finance, climate and nature risk, and change leadership. Compare curriculum, skills, career pathways and ROI to choose the right MBA for a sustainability-driven economy in 2026.
Is a Master in Sustainability Management Worth It in 2026?
Is a Master in Sustainability Management worth it in 2026? A data-driven, honest guide weighing tuition, time and salary against verified green-skills demand from LinkedIn (2025), the WEF Future of Jobs Report (2025) and GMAC (2024) — including who benefits, who should not enrol, and how to assess the ROI.
Sustainability MBA: A Practical Guide to Curriculum, Skills, Careers and ROI
A practical guide to the Sustainability MBA in 2026: what you study, how it differs from a regular MBA, the ESG and climate frameworks (ISSB, GRI, TNFD, SBTi, CSRD) you graduate with, the careers it unlocks, and verified salary and ROI data from GMAC, LinkedIn and the IEA.
Celebrating Business Leaders in Sustainability: SUMAS Graduation 2024
On Friday 6 July 2024, the SUMAS graduating class of 2024 gathered at the SUMAS headquarters in Gland, Switzerland, to mark the completion of their bachelor, master, MBA and DBA degrees. Inside the SUMAS Graduation 2024 ceremony and the new cohort of sustainability business leaders.
Indus International School and SUMAS Partner to Bring Business and Sustainability Education to High School Students in India
Indus International School in India has partnered with SUMAS to deliver the Career-related Studies® "Business & Sustainability" programme to its IBCP high school students, with industry-mentored projects, virtual classrooms, and a fast-track route into a SUMAS Bachelor degree.
5 Examples of Sustainability in Switzerland (2026)
Five concrete examples of sustainability in Switzerland — a near-zero-carbon electricity system led by hydropower, a waste-to-energy and recycling model with no landfilling of combustibles, Swiss Federal Railways (SBB) on 100% renewable power, the ETH Zurich spin-off Climeworks pioneering direct air capture, and the multi-decade restoration of Lake Geneva — explained with verified 2024-2026 data from the Swiss Federal Office of Energy, the Federal Office for the Environment, SBB, Climeworks, and CIPEL. The guide compares the five, sets them against global climate finance and regulation, and shows why Switzerland's model matters in 2026.
7 Reasons to Study Sustainability in 2026
Seven evidence-based reasons to study sustainability in 2026: a fast-growing job market (the green transition adds 34 million jobs by 2030, per the WEF Future of Jobs Report 2025), a skills gap that favours candidates (green hiring grows nearly twice as fast as supply, per LinkedIn), competitive and rising salaries (US BLS median wages of USD 104,170 for environmental engineers and USD 80,060 for environmental scientists), a clear path to senior leadership, measurable real-world impact, skills that transfer across every industry, and a young field where you can specialise and stand out. The guide compares the seven reasons with verified 2024-2026 data and shows how SUMAS programmes turn them into a career.
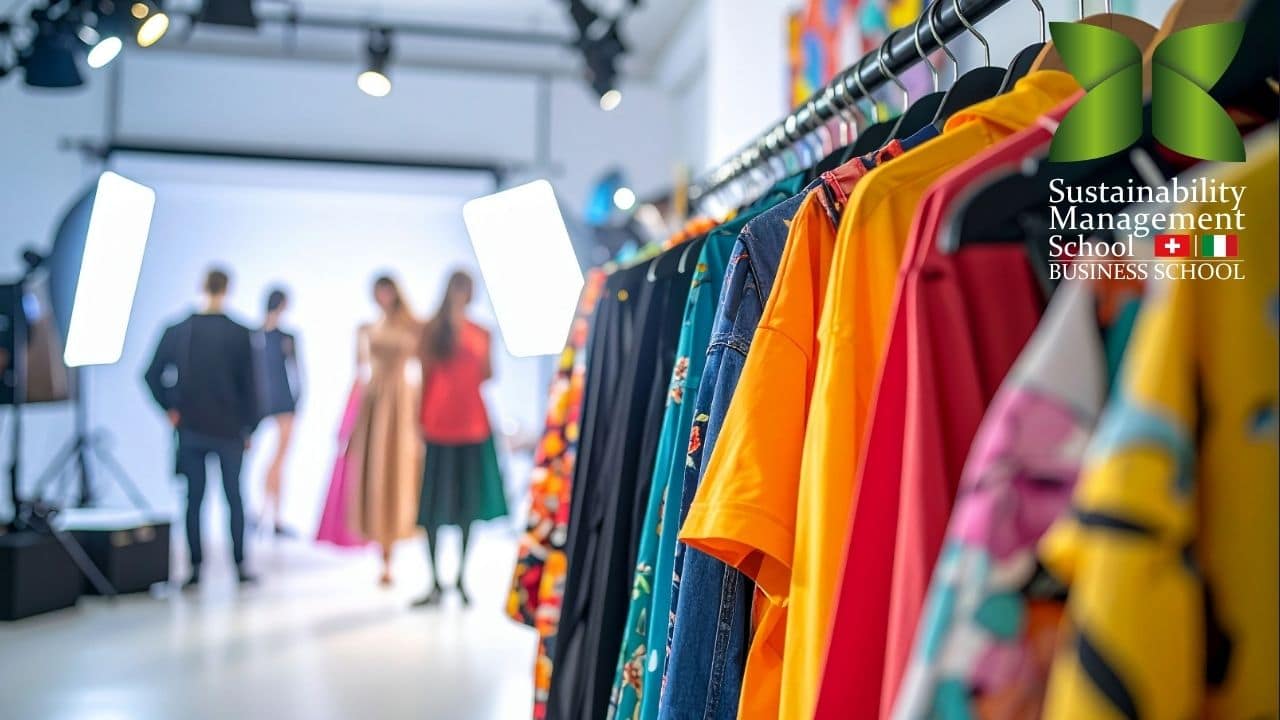
The Future of Sustainable Luxury: Materials, Circularity, Traceability and Trust
The future of sustainable luxury is defined by durability, material traceability and verifiable claims, not green storytelling. Discover how the EU's ESPR destruction ban (19 July 2026), the Digital Product Passport, recycled-material limits (Textile Exchange), and resale growth (State of Fashion 2026) are reshaping high-value goods — and how SUMAS programs prepare graduates for sustainable luxury careers.
Steps to Build a Rewarding Career: A Practical 2026 Guide
A rewarding career aligns your strengths, values and daily work with demand that lasts — not just salary or title. Follow six practical steps: define what reward means to you, choose education tied to durable demand, invest in your strengths, build a small network of honest mentors, seek diverse perspectives, and commit to lifelong learning. Backed by WEF, Gallup, McKinsey and LinkedIn data, with sustainability as a leading field where meaningful work meets growing demand.
Why Choose SUMAS? Accreditation, Campuses, Careers
SUMAS is an ACBSP-accredited Swiss school teaching only sustainability management: campuses in Gland and Milan, online degrees, six scholarships.